Training window
The training window opens as soon as a training starts (Free Training, heart-rate/power profile, or topographic profile). At the top it shows the value bar with the current metrics, below it charts or maps depending on the training type. Two buttons are located at the top right: the gear icon for the settings during training and the question mark for the keyboard shortcuts.
Free training and heart-rate and power profiles show two charts below the value bar, one above the other: heart rate on top (60 % of the height by default, with the heart-rate zones as background bands and, for a heart-rate profile, the target curve), below it (the rest) power (axis on the left, with the target curve for a power profile) together with cadence on an axis of its own on the right. Both charts share the same time axis. The split can be changed in the settings panel. For a heart-rate or power profile they show the whole profile with a little margin at the end at the start; if the training runs beyond it, the window scrolls on. The time window can be changed with the keyboard, see Keyboard shortcuts during training. A click in the chart shows the time as m:ss (h:mm:ss from one hour on) and the measured value with label and unit (e.g. Power (W): 180). Topographic profiles run in a window of their own with 3D maps, see Topographic training.
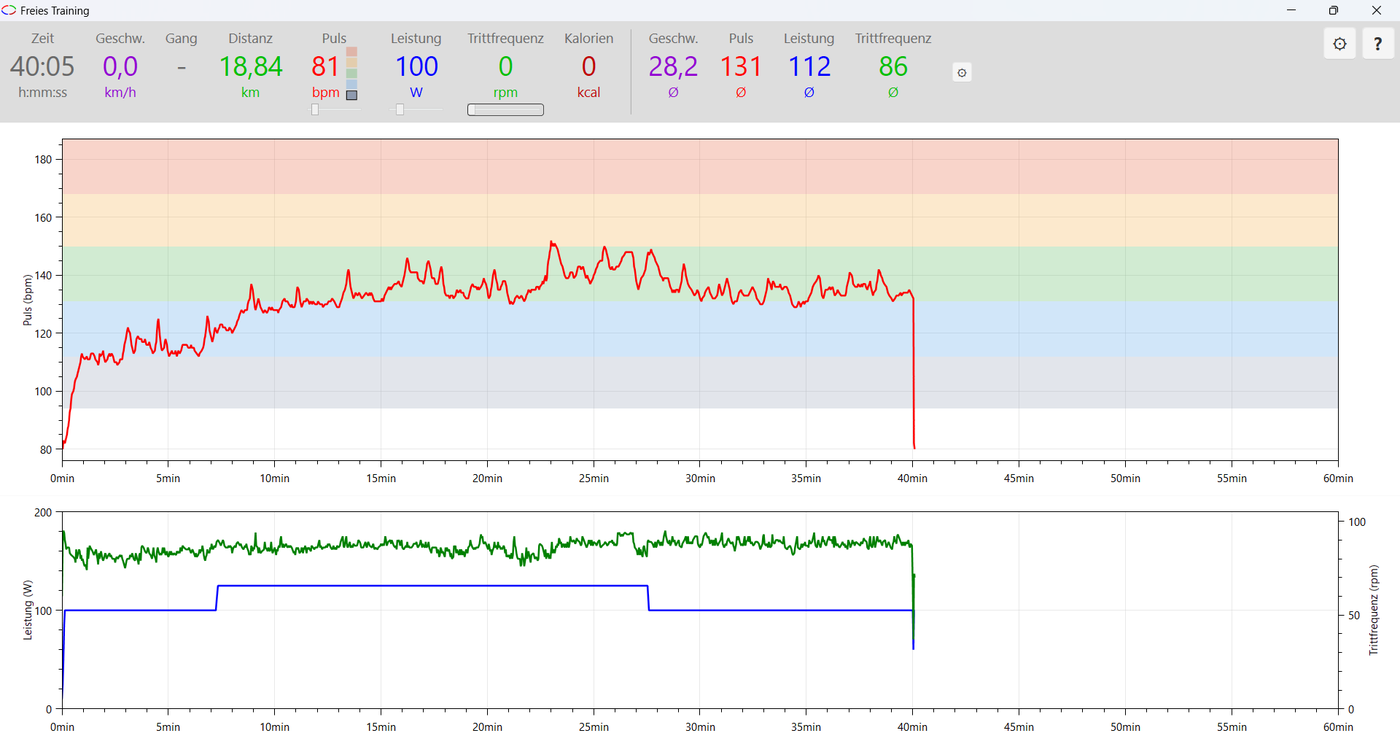
Training window during a free training: value bar on top, below it the heart rate chart with heart rate zones and the chart for power and cadence.
Value bar
The value bar shows, in this order, heart rate, power and cadence, plus speed, the calories burned (in kcal only), the distance (header Distance) and, for topographic profiles, the remaining distance. Both distances are displayed to the nearest 10 m (two decimal places in km). The units are uniformly bpm (heart rate), W (power) and rpm (cadence); speed uses the same purple as its curve in the chart. Time appears compactly as m:ss, with an hours digit only from one hour on (h:mm:ss). While virtual gear shifting is active, the value bar shows the still-unthrottled target power in place of the watt unit below the power value (e.g. → 180 W), see Virtual Gear Shifting. For a heart-rate profile, the same spot shows the target power most recently set by the heart-rate control (initially the user’s starting power), so you can see what the control is currently asking of the ergometer. Likewise, for a heart-rate profile the current target heart rate appears below the actual heart rate instead of the bpm unit (e.g. → 126 bpm), and for a power profile the target power of the profile appears below the actual power (e.g. → 100 W).
Average values
To the right of the current values, the value bar shows four more columns with the running averages of the training for speed, heart rate, power and cadence. They use the colors of the respective instantaneous values, a Ø takes the place of the unit, and a vertical line separates them from the instantaneous values. They can be hidden with the Show average values setting under Settings → Training → Value bar or in the training’s settings panel; the change takes effect immediately. Like the scaling, the setting applies to this Windows user account on this PC and is on by default.
Heart rate zones
Next to the heart rate tile, a vertical bar shows the five heart rate zones in their colors ( Recovery, Light, Medium, Hard, Maximum, each from bottom to top). The zone your current heart rate is in is fully opaque and highlighted with a frame, the others are dimmed. A maximum heart rate must be entered for the user. In the chart of the running training, the zones lie as lightly tinted bands behind the heart rate curve.
The size of the value bar can be adjusted in 5 % steps between 50 % and 300 %:
live during training with Numpad * (larger) and Numpad / (smaller) or with Ctrl + mouse wheel - this also works over the 3D map,
or permanently under Settings → Training → Value bar → Scaling.
Every change is saved immediately and applies again at the next training. The setting applies to this Windows user account on this PC, because the suitable size depends on the screen.
Simulator sliders
If a training runs without a real ergometer (connection dialog: continue with simulated data), three sliders appear below the tiles of the value bar:
Cadence (0-160 rpm),
Heart rate (60-200 beats/min) - locked when the heart rate already comes from a connected heart-rate monitor,
Power (within the power range of the active training device, by default 25-400 watts in 5-watt steps) - locked for heart-rate and power profiles (there the power comes from the profile or the heart-rate control) until the end of the profile is reached - after that the power can be set freely again - and while the virtual gear shifter is active (the power then results from cadence and gear).
The gear symbol to the right of the tiles (tooltip Varianz, variance) opens a popup with two further sliders (0-10) for the variance of cadence and heart rate - this makes the simulated values fluctuate slightly, like real measurements.
Training with a %-FTP profile
A power profile in % FTP only starts if an FTP is stored for the user; otherwise a notice appears (see Power in watts or % FTP).
Coasting and recording
If you stop pedalling (cadence 0) but the training is still running (the display clock keeps running, speed is still above 0), ErControl records training points with cadence 0 and continues the averages with 0. In true standstill nothing is recorded.
Settings during training
The gear icon at the top right (or Numpad ,) opens a settings panel without interrupting the training. Changes take effect immediately and are saved permanently shortly after the last change, at the latest when the training window is closed - no save button is needed. A click next to the panel, on the gear icon, or Esc closes it again.
The panel contains:
Virtuelle Gangschaltung verwenden (use virtual gear shifting, Numpad 0) plus Leistung 1. Gang bei 0 % Steigung (power for gear 1 at 0% gradient), Schrittweite zwischen den Gängen (step between gears), Realitätsfaktor bei Steigung (reality factor for gradient) and Maximalgeschwindigkeit (maximum speed) - see Virtual Gear Shifting.
Automatik aktivieren (enable automatic shifting) together with the shifting limits Herunterschalten bei mehr als (shift down above) / Heraufschalten bei weniger als (shift up below) (in watts). Automatic shifting is only active when a profile is loaded and the gear shifter is switched on; in Free Training the panel shows a note on this. The initial value of the automatic mode is the one last set.
Höhe Pulsdiagramm (heart rate chart height): space for the heart rate chart as a percentage of the window height (30-80 %, default 60 %); power and cadence get the rest. The change takes effect immediately and applies to this Windows user account on this PC. Only for Free Training and heart-rate/power profiles; topographic profiles have a fixed split.
Erholungspulsmessung einschalten (enable recovery pulse measurement) and Trainingsdaten automatisch speichern (save training data automatically).
For heart-rate and power profiles the gear shifter group is omitted (the profile dictates the power); the panel points this out.
These are the same values as under Settings - whatever is changed during training is changed there as well.
Help: keyboard shortcuts
The question mark at the top right (or F1) shows all keyboard shortcuts that actually apply in the current training. The list adapts to the training type and state - for example, the gear shifter keys are missing for a heart-rate profile, and the automatic mode only appears with a profile. Help and settings panel close each other, Esc closes both. The complete overview can be found under Keyboard shortcuts during training.
Topographic training
Topographic profiles always start in the 3D training window. Beforehand, a start window asks where on the route the training should begin, see Profiles.
Layout
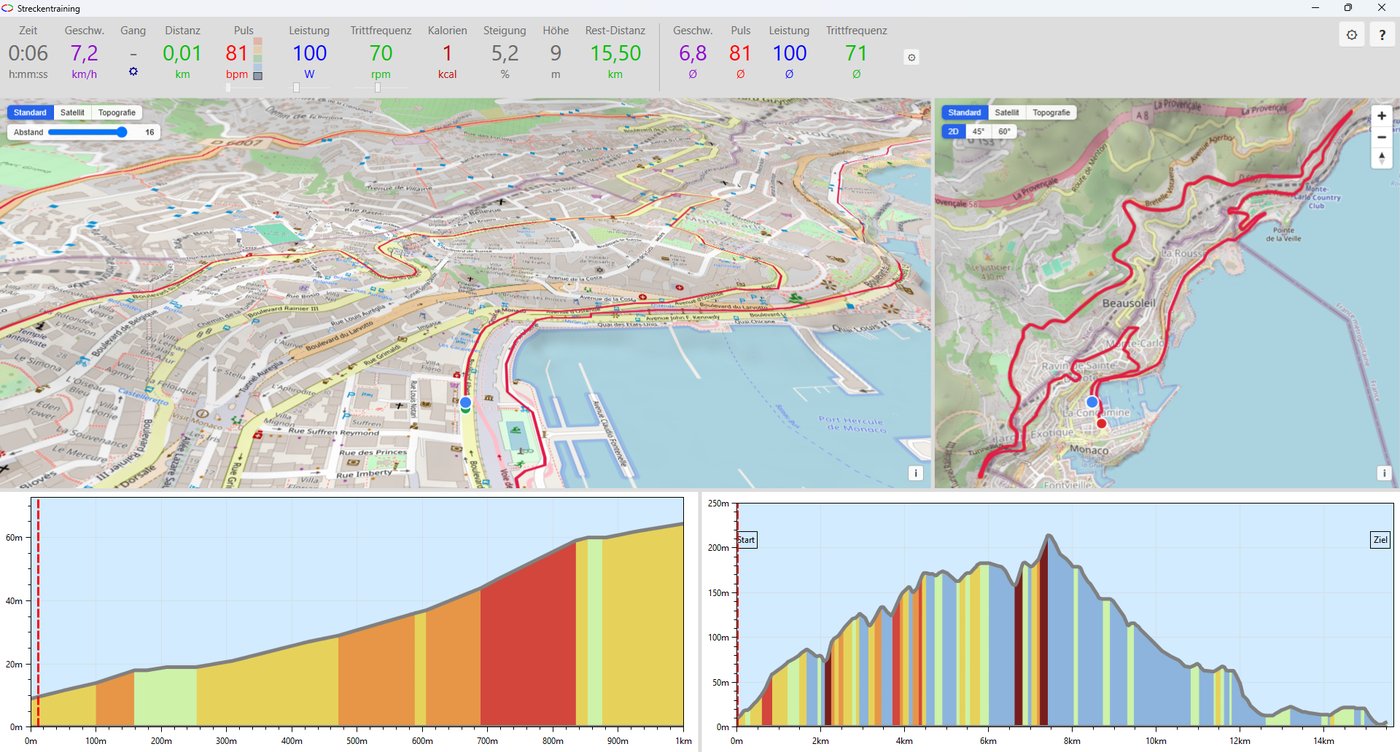
Topographic training: driver view and overview map on top, zoom view and full elevation profile below. Map data: © OpenStreetMap contributors.
Top left: the rider view - a 3D map whose camera follows the rider along the route. The rider stays fixed in the lower third of the image, the view points in the direction of travel. Moving the map with the mouse is deliberately disabled in the rider view. Controls: base map and distance slider, see Map view.
Top right: the same 3D map as a fixed bird’s-eye view of the entire route; only the position marker moves along. Controls: base map and tilt, see Map view.
Bottom left: a zoomed view of the elevation profile around the current position. The visible route section can be changed with Numpad 4 (closer) and Numpad 6 (zoom out) in steps from 200 m to 50 km. Numpad 5 shows or hides marker symbols in the elevation profile.
Bottom right: the elevation profile of the entire route, colored by gradient (see Profiles).
A click in one of the elevation profiles shows kilometers, elevation and gradient at that point. Zooming and panning with the mouse are not available here - set the visible section of the zoom view with Numpad 4/6.
The splitters between the areas can be moved with the mouse. Their positions as well as the chosen zoom level of the profile zoom view are remembered and restored at the next training.
Unlike Free Training and heart-rate/power profiles, this window does not show a heart-rate/power/cadence curve - the space belongs to the maps and profile views.
Map view
The 3D maps have buttons at the top left. Which of them are visible depends on the map:
Buttons |
Profile view (Profiles) |
Training window: rider view (top left) |
Training window: overview map (top right) |
|---|---|---|---|
Base map: Standard (street map), Satellit (satellite image), Topografie (topographic map) |
yes |
yes |
yes |
Tilt: 2D (top-down view), 45°, 60° |
yes |
no |
yes |
Camera mode: Vogel (bird’s-eye view of the whole route), Fahrer (camera follows the position) |
yes |
no (fixed rider view) |
no (fixed bird’s-eye view) |
Abstand (distance) slider (value 12-16 in 0.5 steps, default 14; higher values mean a closer camera) |
only in the rider view |
yes |
no |
The distance is a setting for this Windows user account and can also be changed during training via Numpad 1 / 2 / 3 (closer / default / further away). The choice of base map and tilt is remembered for the next time the map is opened; the camera mode, in contrast, always starts in the bird’s-eye view.
The i button at the bottom right shows the sources of the map currently displayed. All map data comes from third parties and is subject to their terms of use; the satellite image is released for non-commercial use only. An internet connection is required for the maps - during brief dropouts only individual tiles are missing, and the map remains usable.
At the finish
When the ride reaches the end of the profile, ErControl freezes distance and recording: no further training points are recorded and the average values stay as they are. You end the training as usual with the stop button. Heart-rate and power profiles, by contrast, simply keep running after the profile duration has elapsed: the profile control has then ended, the ergometer keeps the power last sent, and the target value displays (→ N W, → N bpm) in the value bar disappear. Once the end of the profile is reached (finish or elapsed profile duration) and cadence is 0, speed stops immediately instead of coasting on; the orange coasting indicator only appears while the bike is actually rolling. In free training and with heart-rate and power profiles, speed is set to 0 immediately at cadence 0 (coasting only happens in topographic training).
Recorded distance
The distance of a topographic training always counts from 0, regardless of the chosen start distance on the profile: it is the odometer of the training itself. If a training begins at km 20 of the profile, for example, the training overview shows 5 km after 5 kilometers ridden - elevation, gradient and position on the map, however, still follow the absolute position on the profile.