Training Detail
The training detail page shows a single training at a glance: metrics as tiles, the heart rate zones, the route ridden on the map and charts. It opens with a double-click on a training in the Training Overview. The Back button at the top left returns to the overview; the training viewed last is then highlighted there, and the table scrolls to it. This also applies if you leave the detail page via the navigation bar and open the training overview again. The highlighted row then has the keyboard focus, so the arrow keys continue from it.
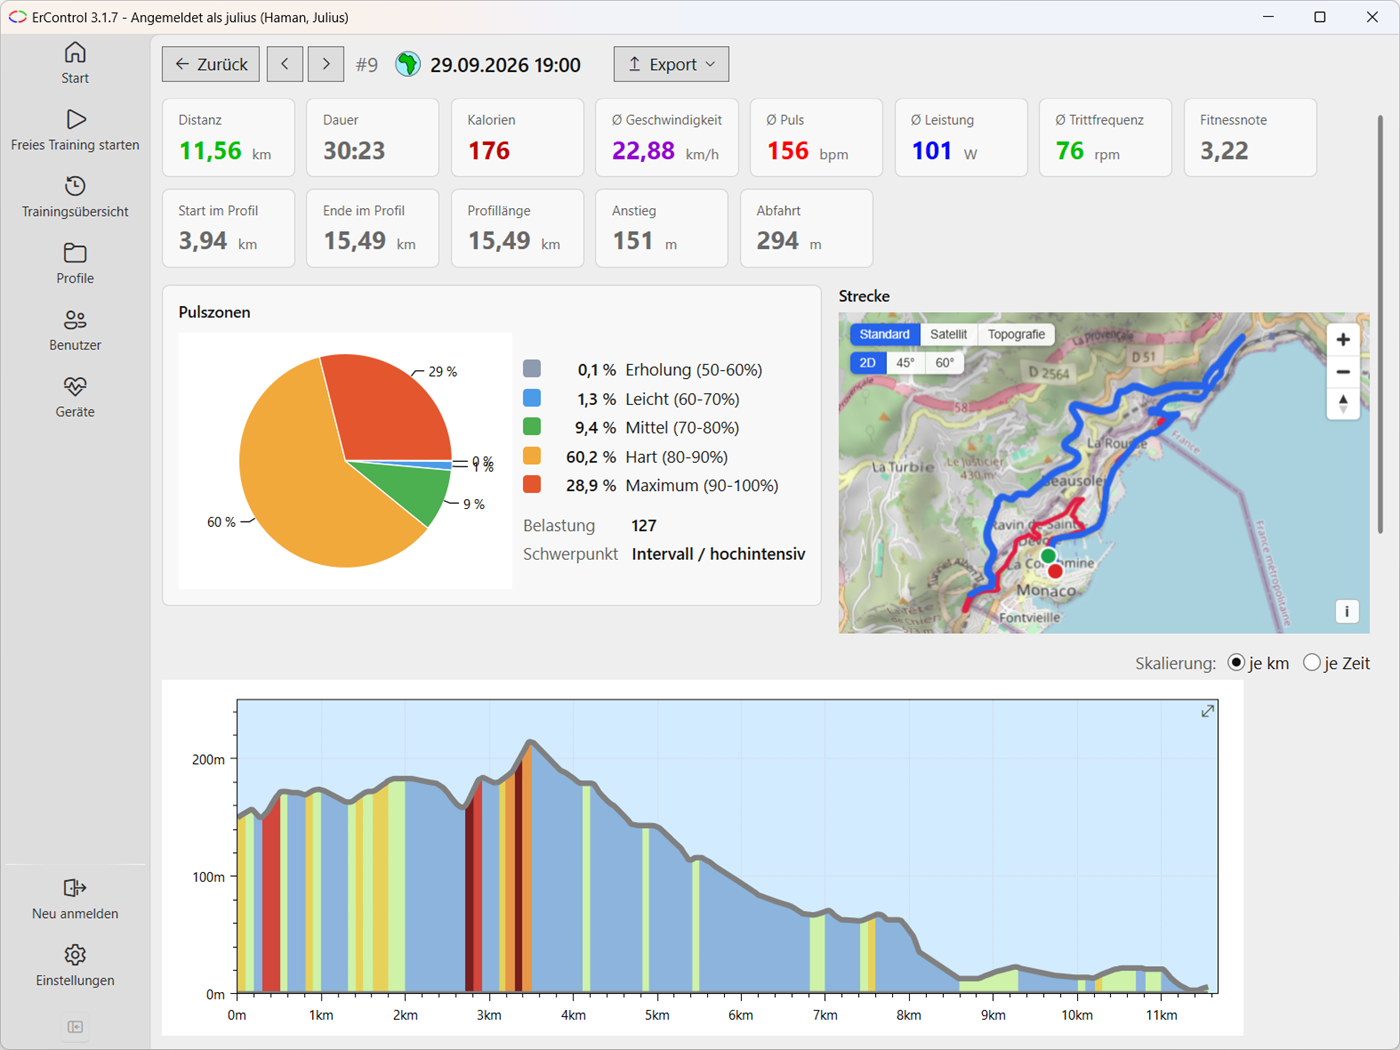
Training detail of a topographic training: tiles, heart rate zones with load and focus, map and terrain profile.
Paging
With the two arrow buttons directly to the right of Back (tooltips Previous training and Next training) you page through the trainings, in the same order as in the overview (newest first). If you then go back to the overview, the training viewed last is highlighted, not the one with which you opened the detail page.
For a topographic training whose profile has not been ridden to the end, the button Continue profile at x km sits next to them, see Continue Profile.
ID
Directly behind the paging buttons is the ID of the training: its internal number with a leading #, for example #501. It is assigned automatically and stays the same for the training permanently. The same number is the first, fixed column in the Training Overview - handy for referring to a training unambiguously, for instance when asking questions.
Export
The Export button exports the displayed training - via the same menu (Export (TCX), Export (FIT), Export (HRM), Export (CSV)) as in the training overview.
Tiles
The tiles show the metrics of the training, in this fixed order: distance, duration, calories, Ø speed, Ø heart rate, Ø power, Ø cadence and fitness score. The unit (km, km/h, W, bpm and so on) is shown small after the number; a leading Ø stands for the average. As in the value bar, the duration appears as m:ss, and from one hour on as h:mm:ss; heart rate and cadence carry the units bpm and rpm.
For topographic trainings, a second row with the profile-related tiles follows below:
Start in profile and End in profile: the positions on the profile at which the training began and ended,
Profile length: the total length of the profile ridden,
Ascent and Descent: the elevation gained and lost.
The numbers are colored as in the value bar of a running training (Training window): distance and cadence green, heart rate red, power blue, calories dark red, everything else gray.
Note
The distance of a training always counts from 0, even if a topographic training began at a later kilometer of the profile. Where in the profile the training began and ended is shown by the two tiles Start in profile and End in profile. For topographic trainings recorded before the start distance was introduced and comprising more than one ride, the start position cannot always be reconstructed - there, the start in profile is shown as 0 km.
Heart rate zones
The pie chart shows what share of the training time you spent in each of the five heart rate zones. The segments have the colors of the zones:
Color |
Zone |
|---|---|
Recovery |
|
Light |
|
Medium |
|
Hard |
|
Maximum |
In the legend next to the chart, the percentage is shown before each zone name; zones with 0 % appear only there, not in the circle. A click on a segment shows the zone, seconds and share. The basis are the zone limits that applied at the time of the training (the maximum heart rate saved with the training), not your current maximum heart rate.
Load and focus
Below the legend are two further values, calculated from the distribution of heart rate zones:
Load: the training stimulus as Edwards TRIMP - for each heart rate zone, the minutes spent in that zone times its zone number (1-5), summed up. Time below zone 1 (under 50 % of maximum heart rate) counts as 0.
Focus: one of five categories - Recovery, Base endurance, Threshold / tempo, Intervals / high intensity or Mixed - determined by rules from the time shares of the heart rate zones alone, independent of the load. Trainings under 10 minutes of heart-rate data get no focus (the distribution would be too random); the load is still calculated.
Points without a heart rate reading count as zone Recovery here. Both values are calculated when the training is saved and stored with it, so they can appear in the Training Overview as selectable columns without having to load all measurement points there for every training (see Columns there). Existing trainings receive the values once, the next time the program starts after the update; if no maximum heart rate was known yet at that point, ErControl calculates them retroactively as soon as one is entered in the user profile for the first time.
Route
For topographic trainings, the map to the right of the pie chart shows the route. The section actually ridden is highlighted, the rest of the profile is shown subtly. The map can be operated like the other map views (Map view); here, however, the mouse wheel scrolls the page and does not zoom the map.
Charts
Below the tiles, a separate chart for each measured value shows the course of the training, as on Garmin and Strava: heart rate, power, cadence and speed, one below the other in this order. Each has its own axis on the left with the unit. A chart without measured values - for example heart rate without a chest strap or cadence without a sensor - is hidden.
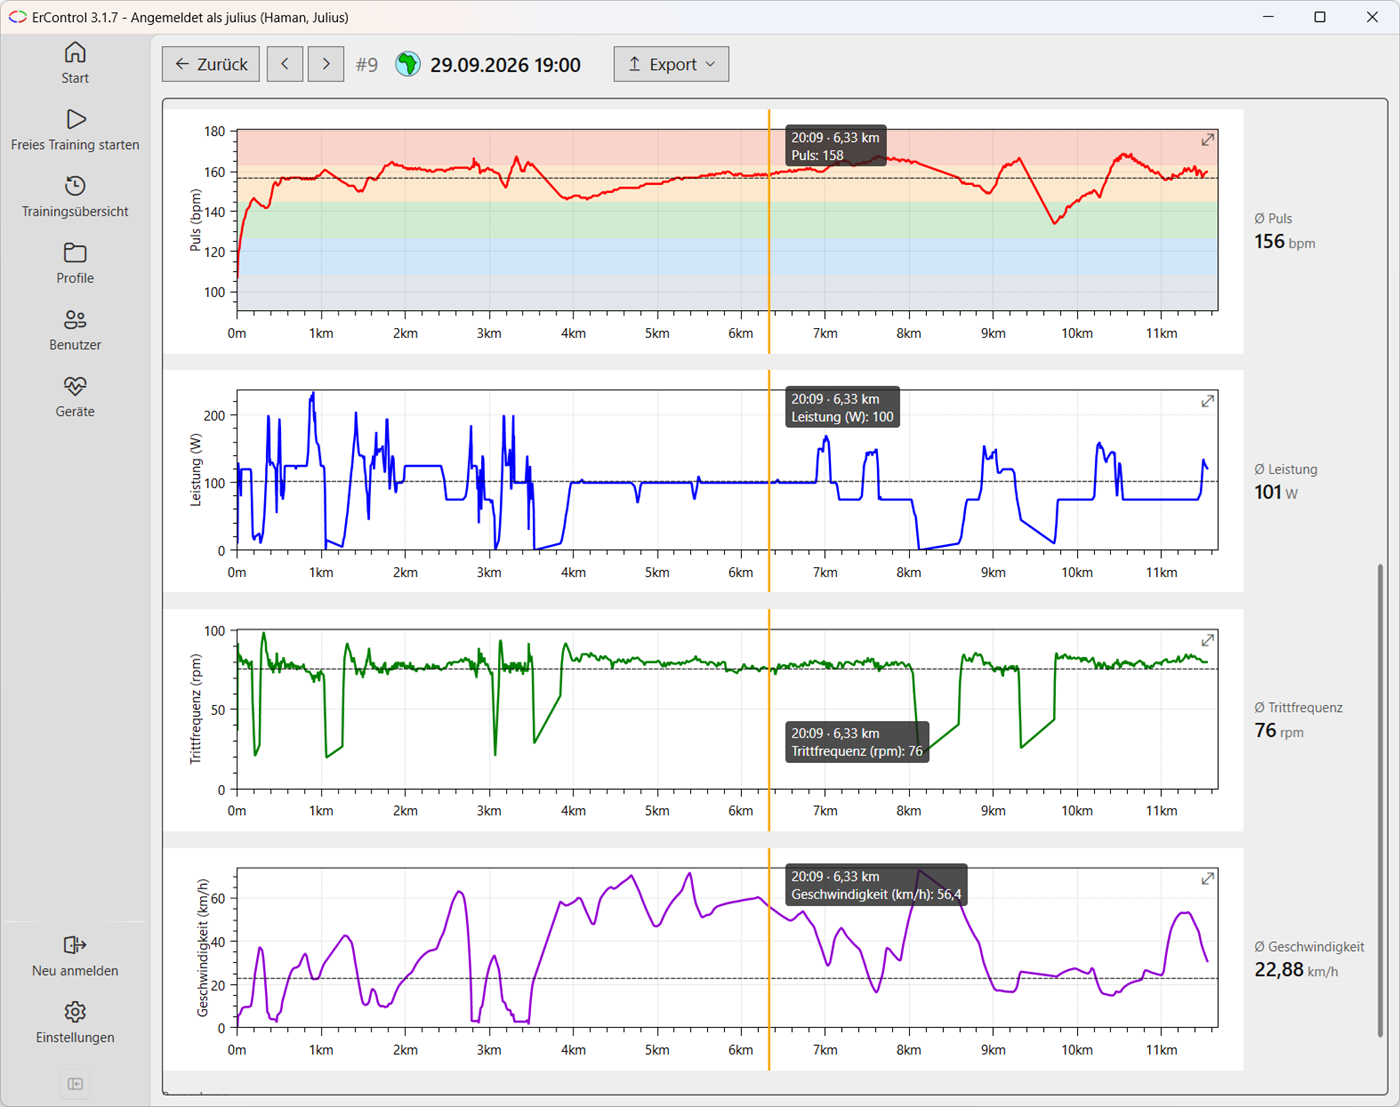
The measurement charts for heart rate, power, cadence and speed with guide line and tooltips; the averages on the right.
Free training and heart-rate and power profiles: the four measured-value charts over time. The heart rate chart has the heart rate zones as lightly tinted background bands (limits from the training’s stored maximum heart rate) and, for heart rate profiles, the target curve.
Topographic trainings: additionally at the very top the terrain profile of the route actually ridden, colored by gradient as in the profile (Gradient colors in the elevation profile), below it the four measured-value charts. The terrain profile has no heart rate zone bands because its value axis is the elevation.
As in the profile view, all charts can be zoomed with the mouse wheel and panned with the right mouse button held down (Operating the chart). The X axes of the charts are coupled: zooming, panning and resetting affect all charts together.
Average
In every measured-value chart, a dashed horizontal line shows the average of the measured value over the whole training. The value is shown to the right of the chart, for example Ø pulse with 138 bpm; it matches the tile of the same name. The terrain profile has no average line.
Maximizing a chart
The button with the arrow at the top right of a chart opens it maximized in a window of its own. There, the mouse wheel zooms (unlike on the detail page, where it scrolls the page), the orange guide line with its tooltip works as on the detail page, and the average is again shown to the right of the chart. The X axis has the same scale as the detail page. Esc or the window’s close button takes you back to the detail page; the window is modal, so the detail page cannot be used while it is open.
Heart rate axis
The axis of the heart rate chart runs from the lower limit of zone 1 (50 % maximum heart rate) to the upper limit of zone 5 (100 %), so the five zones fill the height of the chart. If a recorded heart rate is above the maximum heart rate or below zone 1, it is still displayed - the axis then widens accordingly. Without a known maximum heart rate, the axis scales automatically to the available values. The heart rate zone bands and, for heart rate profiles, the target heart rate curve also lie on this axis. The other charts each have only their own axis (W, rpm, km/h or, for the terrain profile, the elevation).
Scaling the X axis
For topographic trainings, all charts share the same X axis, which lines up exactly from one chart to the next. With Scale you can switch the axis between per km (default) and per time. The choice is remembered. The gradient coloring of the terrain profile works in both scales. All other training types show the charts over time.
Aiming and Tooltips
When you move the mouse over a chart, an orange guide line follows it. The associated tooltip shows time and distance of the nearest recorded point as well as the measured value of this chart, for example Power (W): 180 or Cadence (rpm): 85. The terrain profile shows the same tooltip as the profile overview: distance, elevation and gradient; with the scale per time, the training time is shown in front.
The lines run in sync in all charts: if you move the mouse in one chart, the line with its tooltip also appears in the others, and for topographic trainings a marker additionally moves along on the map so that you can see where on the route the value was recorded.
The time in the tooltips is shown compactly as m:ss (h:mm:ss from one hour on). The click tooltips of the live charts in the training window and the profile overview also show the time this way.
Note
At the very bottom of the page is the multi-line field Note, in which you can keep a note of your own for each training, for example about weather, how you felt or special events. The input is saved automatically: shortly after the last keystroke and immediately when you leave the page via Back, the paging buttons or Continue profile. There is no save button. If you empty the field, the note is removed.
The note also appears in the Training Overview (as a selectable column, see Columns there) and is carried over into the TCX export. Notes from ErControl 2 are taken over by the database migration.
Continue Profile
A topographic training whose profile has not yet been ridden to the end can be continued at its end position: next to the paging buttons, the detail page shows Continue profile at x km, and in the Training Overview Continue is active for this training. Both first open the start window with the end position of the training as the pre-filled start distance, which can still be changed there; Start then opens a new topographic training in the 3D training window (Training window) from that distance, Cancel closes the window without starting a training. So it does not continue the same training, but creates another entry in the overview once actually started. The button and Continue are only available as long as at least 100 m of the profile remain. Anyone who has ridden the profile to within a few metres of the end (for example, ending at 15.50 km on a profile length of 15.51 km) can no longer continue there.